Xue Sun
Water consumption in our lives consists of the directly visible ‘real water’ and the ‘virtual water’ consumed in the production, processing, transportation, and other processes. The sum of the two is the Water Footprint (WF) embedded in our daily consumption. Most current water science publicity is still limited to real water conservation that accounts for a tiny proportion of personal WF, the remaining huge part of virtual water involves greater consumption with excellent potential for water conservation without receiving due attention.
From virtual water to WF
Do you drain a lot of cold water for nothing during waiting to get a cup of hot water? Do you turn off the faucet at intervals when using water like washing your face or brushing your teeth? Do you start with little things, such as taking the initiative to use water-saving appliances …? If you have already noticed the above points regularly and are confident that you are a good water saver, then this article might refresh your perception and help you find a new focus on the road to water conservation.
Most people focus on saving visible ‘real water’ while rarely considering the existence of ‘virtual water’. Take the mineral water we drink as an example. The consumed part is real water and the water applied during the production, processing, and transportation of water bottles is called virtual water as it barely becomes part of the final product. The concept of WF builds on the concept of virtual water and refers to the amount of water required for all products and services consumed by any known population (country, region, or individual) over a given period. It takes a view of water use throughout the product supply chain, breaking away from the tradition of counting water use from a single process. It is a multi-dimensional indicator due to its inclusion of the composition (blue water from surface and groundwater, green water from soil water, and gray water in sewage) and temporal-spatial features (Mekonnen & Hoekstra, 2012). The WF offers a deeper understanding of the connection between daily consumption habits and water conservation by incorporating a life-cycle assessment of water consumption along the entire chain from farm to fork (Yang et al., 2013), driving interest in environmental protection and sustainability into direct changes in daily consumption habits (Aldaya et al., 2010).
Your WF is embedded in your meals?
The sustainability of consumption could guide production suppliants and occupies a crucial position in sustainable socio-economic development. Food consumption is the most basic human consumption activity and a major issue for the world as SDGs place Zero Hunger as an essential topic. It accounts for about 22% of total greenhouse gas emissions (McMichael et al., 2007), and is considered firmly correspond to the climate change crisis and the green world vision.
As a vital part of the diet, ‘water’ is related to both the health of food and the global environment, regarding SDG goal 6: Clean Water and Sanitation and 14: Life Below Water. The human body takes in about 2.7-3.7L of water per day through diet(Sawka et al., 2005), yet it takes much more than this to prepare food. The process of cleaning and cooking ingredients requires visible ‘real water’ while the growth of animals, processing, and transportation of raw materials also require extensive invisible ‘virtual water’. The diet not only contains the cost of visible ingredients but also includes the ‘cost of water’. So, how much ‘water costs’ do we need to make for each meal we consume in our daily lives?
A country’s WF is immensely related to its people’s diet structure, higher consumption of meat parallel to a larger WF. Western countries with a predominantly animal-based diet have a WF of 2000 m3 each year while Asia and the Middle East, where vegetarian diets are the mainstay, have an annual WF of 1000 m3. Consumers in the United States enjoy an average WF of 2,842 m3/y, whereas the citizens in China and India have an average WFs of 1,071 and 1,089 m3/y (Hoekstra & Mekonnen, 2012), who at the national scale are the world’s three largest virtual water consumers (Chen & Chen, 2013). Reliance on irrigation for food production can lead to a large WF, especially in hot climates.
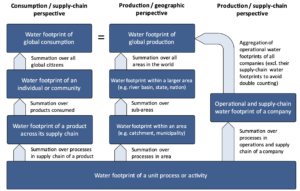
The relation between different water footprints. Water footprints of single processes or activities form the basic building blocks for the water footprint of a product, consumer, or producer or for the footprint within a certain geographical area. The footprint of global consumption is equal to the footprint of global production(Hoekstra, 2017).
The individual WF further displays the relationship between consumption patterns and water consumption. The average WF per calorie for beef is 20 times larger than for cereals and starchy roots (Mekonnen & Hoekstra, 2012), animals consume large amounts of water for crops, drinking water, and production services. A 3-year-old cow that can obtain about 200kg of boneless beef, exhausting 1300kg of grain, 24m³ of drinking water, and 7m³ of water for production services in its lifetime, that is, an average of 15,340 liters of water per kilogram of beef(Schwartz, 2010). Nevertheless, the water consumption of agricultural products should not be underestimated. Consumption of cereal products gives the largest contribution to the WF of the average consumer (27%), followed by meat (22%) and milk products (7%) (Hoekstra & Mekonnen, 2012). A 125ml cup of coffee requires about 140 liters of water. That is over 1,400 drops of water to make a single drop of coffee, with the growing process of coffee beans requiring the most water(Chapagain & Hoekstra, 2003). For the world, 110 billion m³ of water is consumed annually to produce coffee, equivalent to 1.5 times the flow of the Rhine River (Chapagain & Hoekstra, 2007).
How can we calculate our personal WF?
You can visit the WF Calculator website(https://www.waterfootprint.org/en/resources/interactive-tools/personal-water-footprint-calculator/), run by the University of Twente in the Netherlands. By simply selecting nationality, gender and diet, you are expected to get a rough calculation. If you are patient enough to fill in the details of weekly toileting, showering, food intake, car-washing, and gardening, you can get a more accurate number.
Every drop from your diet counts!
At a time of tension in Europe’s breadbasket, Ukraine, future prices for agricultural commodities such as wheat have spiked across the board and the world’s food security is progressively at risk. With the assistance of WFs, we can better dig into the hidden water consumption behind our daily lives, enjoying the benefit of a more scientific perspective on water conservation. Dietary structures reflect a region’s geographic feature and historical culture, as well as a unification of water science, water culture, and water life. In addition to the splendid food culture created by our predecessors, why cannot we develop a new trend of resource-saving and eco-friendly diet?
WF reduction can be achieved in two methods, either through technological substitution and innovation (Renault, 2003) or by avoiding or minimizing our daily usage, the second is more important as it requires a revolution of production and consumption patterns for the efficiency of water use. Consumers are responsible for their consumption behavior and are involved in water resources, expected to optimize their diets through suitable replacements like consuming less meat and drinking fresh water instead of coffee (Ercin & Hoekstra, 2014). Such behaviors allow consumers show their preference to low WF products and inspire producers to take a specific fraction from sustainable products . Producers would then shoulder the responsibility for sustainable development by producing sustainable food with decreased WF.
Finally, water is a public resource and governments have an inevitable liability to enhance awareness of water conservation among consumers and producers, restructuring water pricing mechanisms to ensure the cost of final products represents the entire water cost. Governments should put forward appropriate policies and local incentives to push sustainable production and consumption of food, and continuously guide the public towards the rationalization of food consumption to conserve water and improve the efficiency of WF utilization. Thus, consumers, producers, and the government all should work coordinately and physically to effectively reduce WF.
With the market mechanism of resource allocation, the socio-economic system of the specific region is inextricably connected to the socio-economic systems of other regions through trade. The local water cycle is no longer influenced by local factors alone but would extend to all trading regions (Chen & Chen, 2013). Indeed, the exchange of products amidst many regions to meet and further influence water demand has become a fundamental way to regulate water demands macroscopically (Allan, 1998; Oki & Kanae, 2004), among which 43% of the international virtual water flows is embodied in food-related trade (Chen & Chen, 2013). If a country imports water-intensive products rather than produces them, it is importing ‘virtual water’ simultaneously (Allan, 1998). For water-deficient countries, importing virtual water to alleviate the local water crisis is an attractive option as it overcomes the disadvantages of long distances, huge costs, and lack of ecological security in real water allocation, equivalent to completing the secondary distribution of water resources employing trade(Hoekstra & Hung, 2005). For example, the water use efficiency of rain-fed agriculture (a large green WF) in water-rich areas is often depressed and efficiency improvement in these areas can boost global water productivity and reduce the production of high water-consuming products with relived pressure on blue water resources in water-deficient areas (Yang et al., 2006).
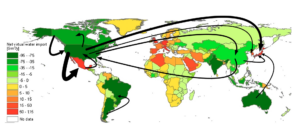
Virtual water balance per country and direction of gross virtual water flows related to trade in agricultural and industrial products over the period 1996–2005. Only the biggest gross flows (>15 Gm3∕y) are shown (Hoekstra, 2012).
Conclusion
In terms of virtual water and water footprint, we could find simpler, plainer, and more effective methods for the conservation of water. We are expected to change our dietary structure to a less water-required one, from cradle to grave, to shoulder our responsibility of guarding the water system of our beautiful blue planet. Locally, regionally and internationally, consumers can serve as the core of the production chain, educated by governments in coordination with stimulating produces to save each drop and achieve related SDG from a diet perspective.
References:
Aldaya, M. M., Martínez-Santos, P., & Llamas, M. R. (2010). Incorporating the Water Footprint and Virtual Water into Policy: Reflections from the Mancha Occidental Region, Spain. Water Resources Management, 24(5), 941–958. https://doi.org/10.1007/s11269-009-9480-8
Allan, J. A. (1998). Virtual water: A strategic resource. Ground Water, 36(4), 545–547.
Chapagain, A. K., & Hoekstra, A. Y. (2003). The water needed to have the Dutch drink coffee. Unesco-IHE.
Chapagain, A. K., & Hoekstra, A. Y. (2007). The water footprint of coffee and tea consumption in the Netherlands. Ecological Economics, 64(1), 109–118. https://doi.org/10.1016/j.ecolecon.2007.02.022
Chen, Z.-M., & Chen, G. Q. (2013). Virtual water accounting for the globalized world economy: National water footprint and international virtual water trade. Ecological Indicators, 28, 142–149. https://doi.org/10.1016/j.ecolind.2012.07.024
Ercin, A. E., & Hoekstra, A. Y. (2014). Water footprint scenarios for 2050: A global analysis. Environment International, 64, 71–82. https://doi.org/10.1016/j.envint.2013.11.019
Hoekstra, A. Y. (2017). Water Footprint Assessment: Evolvement of a New Research Field. Water Resources Management, 31(10), 3061–3081. https://doi.org/10.1007/s11269-017-1618-5
Hoekstra, A. Y., & Hung, P. Q. (2005). Globalisation of water resources: International virtual water flows in relation to crop trade. Global Environmental Change, 15(1), 45–56. https://doi.org/10.1016/j.gloenvcha.2004.06.004
Hoekstra, A. Y., & Mekonnen, M. M. (2012). The water footprint of humanity. Proceedings of the National Academy of Sciences, 109(9), 3232–3237. https://doi.org/10.1073/pnas.1109936109
McMichael, A. J., Powles, J. W., Butler, C. D., & Uauy, R. (2007). Food, livestock production, energy, climate change, and health. The Lancet, 370(9594), 1253–1263. https://doi.org/10.1016/S0140-6736(07)61256-2
Mekonnen, M. M., & Hoekstra, A. Y. (2012). A Global Assessment of the Water Footprint of Farm Animal Products. Ecosystems, 15(3), 401–415. https://doi.org/10.1007/s10021-011-9517-8
Oki, T., & Kanae, S. (2004). Virtual water trade and world water resources. Water Science and Technology, 49(7), 203–209. https://doi.org/10.2166/wst.2004.0456
Renault, D. (2003). Value of virtual water in food: Principles and virtues. Hoekstra, AY (Ed.).
Sawka, M. N., Cheuvront, S. N., & Carter, R., Iii. (2005). Human Water Needs. Nutrition Reviews, 63(suppl_1), S30–S39. https://doi.org/10.1111/j.1753-4887.2005.tb00152.x
Schwartz, H. (2010). Water footprint of beef production: Critical review of current approaches. Revista Argentina de Produccion Animal, 30, 225–229.
Yang, H., Pfister, S., & Bhaduri, A. (2013). Accounting for a scarce resource: Virtual water and water footprint in the global water system. Current Opinion in Environmental Sustainability, 5(6), 599–606. https://doi.org/10.1016/j.cosust.2013.10.003
Yang, H., Wang, L., Abbaspour, K. C., & Zehnder, A. J. B. (2006). Virtual water highway: Water use efficiency in global food trade. Hydrology and Earth System Sciences Discussions, 3(1), 1–26.