With our new Kjeldahl Labster lab (virtual lab), we did a small experimental study. We wanted to know how well students would perform in comparison to a demonstration in the lab (physical lab). Our hypothesis was that both groups would perform the same.
Setup
Group 1 (28 students), the physical lab group, participated in the Kjeldahl demonstration in the physical lab.
Group 2 (30 students), the virtual lab group, did the Kjeldahl experiment in the 2D (two-dimensional) Labster lab.
All the students were tested with the same moodle quiz.
An important difference (worth mentioning in this context) between a physical lab and a virtual lab (so far) is that students can ask questions during a demonstration in a physical lab and get clarifying answers. On the other hand, in the virtual lab, students have access to theory pages and literature if they want to look something up. Furthermore, if one is not motivated, in a demonstration, one must at least be physically present for the duration of the demonstration. Using the virtual lab, to gain time, one can go through the virtual lab as fast as possible or do something in parallel.
The demonstration took up to 60 minutes in the physical lab. Although the data available to us is not entirely reliable[1], students, on average, spent 50 minutes playing through the virutal lab.
Results
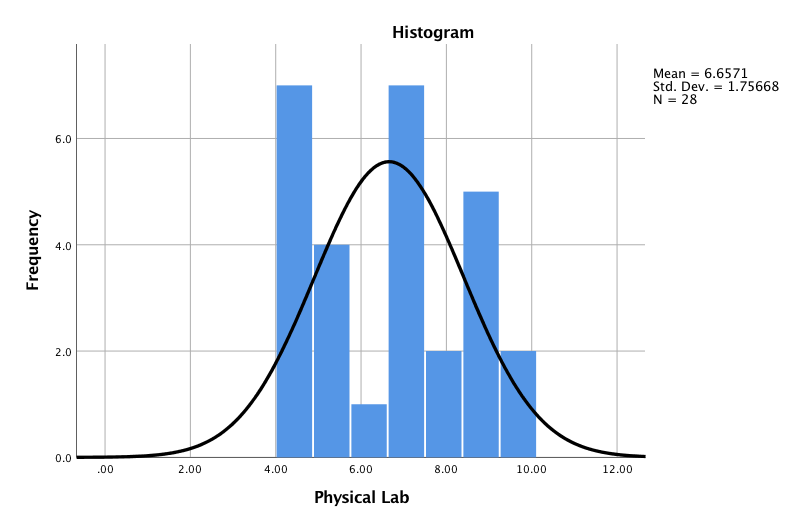
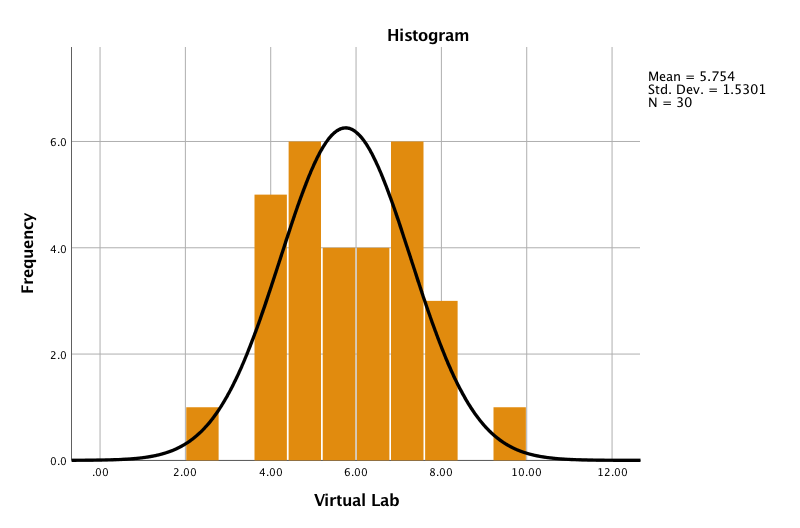
Neither group[2] performed well in the test. The physical lab group performed slightly better with an average of 6.66 points out of 12 (55.55%) in comparison to the virtual lab group with 5.75 points (47.95%). This is a better result of the physical lab group by 0.91 points (7.5%). The standard deviation for the physical lab group is 1.75 points (14.5%), for the virtual lab group it is 1.5 points (12.5%).
? Click on the graphs to enlarge them!
Physical Lab Histogram
Virtual Lab Histogram
Comparison of the Groups
The difference in achievement is significant[3], and there is a medium effect size[4].

Results by Question
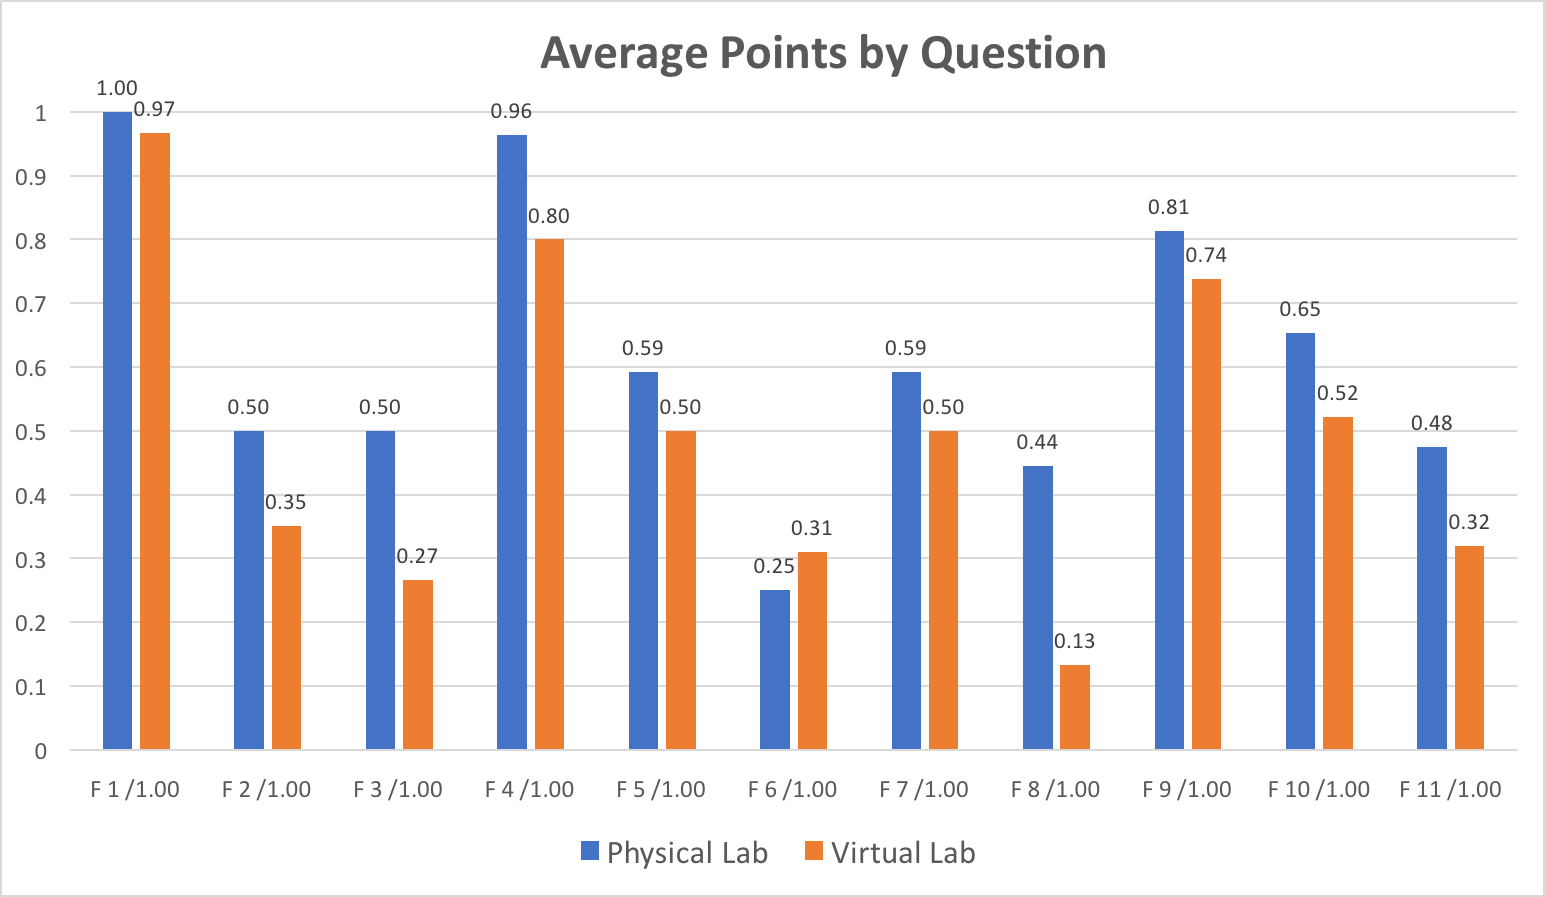
Specific Questions’ Results
The two following questions (F3, F8) were answered significantly better by the physical lab group.

Question F3
Most students (25) chose the third option instead of the fourth option, chosen by 22 students. This question may assess underlying logical thinking more than concepts about the Kjeldahl method, and the word ‘Gehalt’ may have been wrongly interpreted. Both reasons (logical thinking and the meaning of ‘Gehalt’ in this context) may explain the result but are, rightly so, expected of students.
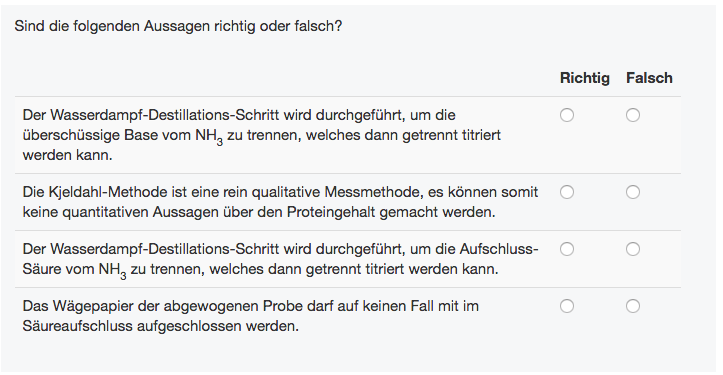
Question F8
The pleasant result about question F8 is that 88% of the students correctly assessed the second statement. Why they didn’t manage to assess the fourth statement correctly –in the virtual lab the paper goes into the mixture without choice; there is a picture of the mixture where the paper is visible in a later question in the test– is a mystery to us.
The following question (F6) was better answered by the virtual lab group.

Question F6
The reason for this result is clearly that there are more formulas and calculations (especially in the quiz questions) in the virtual lab than there were in the demonstration (physical lab). Additionally, maybe, it is more difficult to understand formulas and calculations if these are mostly only mentioned orally. In any case, both groups had difficulties. Only 9 students of the virtual lab group and 6 students from the physical lab group answered correctly.
Flaws in our study
The following points are flaws in our study and would have to be taken into consideration for a next study.
- Language
The language of the lab course, the demonstration and of the moodle quiz is German. The virtual lab is in English. Some students may have had difficulties with the needed translation of what they had learned in the virtual lab. - Independence of personnel
The person who did the demonstration also designed the moodle quiz. The same person was also involved in the design of the virtual lab. Nonetheless, we do not think that it had any impact on the results. - Technical issues
Many students tried to fill out the moodle quiz in the last minutes and used their mobile devices. At least three of the moodle questions (Drag & Drop with pictures) were almost impossible to answer on small screens. (Pictures could not be dragged to the designated spots.) - Incentives
There were no incentives at all for students to perform well. They had to do the experiment (physically or virtually) and the moodle quiz (next to many other things that were part of the course) and they did, but not with a lot of motivation or ambition. No consequences were set up for a bad performance. - Congruence of content
The physical lab demonstration was more focussed on the Kjeldahl experiment while a significant part (more than 50%) of the virtual lab consists of LC-MS and interpreting its results. The virtual lab was designed this way because there is not much access to LC-MS in the real labs. It was designed for sustainable use in the future and not for this particular experimental study. - Tested subject matter
In lack of other possibilities, we mainly tested conceptual knowlege. If at all possible, a better alignment of the activities and the test would be desirable.
Conclusion
In this study, our hypothesis is proven wrong. There was a significant difference in the (conceptual) learning outcome between instruction in a physical or a virtual lab. Probable reasons for the difference of the groups’ results may well be explained by the possibility of asking questions during a physical lab (or being forced to be physically present), the ‘incentive’ flaw and the ‘congruence of content’ flaw mentioned above. If set up more appropriately, we believe the results would have been different.
The use of virtual labs is, despite the presented results, not at all a second rate teaching method and should be used when needed. Reasons to use virtual labs, of which there are many, are discussed in “Our First Success Story“. And, it is surely always better to use a virtual lab than no lab at all!
Acknowledegments
This study (and everything around it) would not have been possible without the indispensable help and profound knowledge of Dr. Melanie Erzinger and Dr. Samy Boulos.
- The 'time taken' for the virtual lab ranges from 26 minutes to 21 hours. Taking the obvious wrong data points (duration over three and a half hours) out of the equation, our students spent 50 minutes in the virtual lab on average. ↵
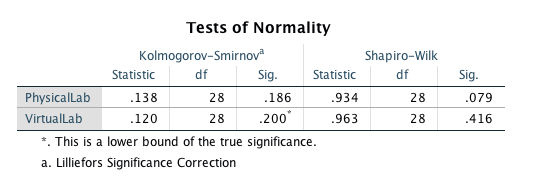
- Both groups are normally distributed following the Shapiro-Wilk test.
- T-Test Results (p: physical group, v: virtual group)
- Cohen's d = 0.548234; Gates' delta = 0.514095; Hedges' g = 0.549582;
r = 0.26436453 Links: Effect size calculator by socscistatistics and effect size calculator by polyu.edu; Interpretation
