15.1 – Graphs: Tourism in Egypt
The two charts below show the importance of Tourism to Egypt’s economy. Write a report based on the information in the two graphs.

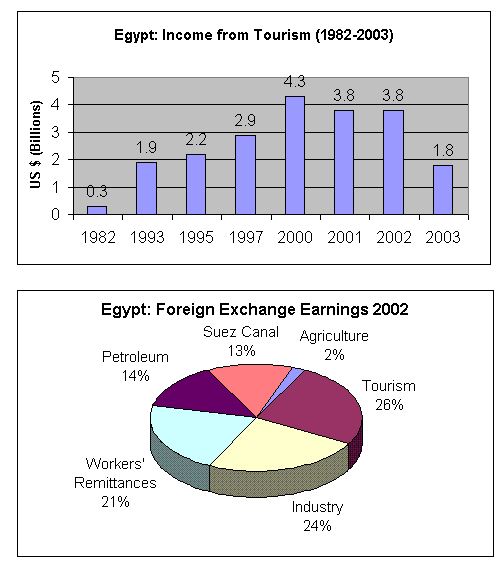
The graphs above show how important tourism is for Egypt. Overall, even though tourism is the biggest sector in the economy, the income fluctuates sharply from year to year.
The bar chart shows the foreign exchange earned by Egypt. The biggest sector is tourism, at 26% of the foreign exchange earnings. This is followed by industry, at 24%, and Workers’ remittances, which make up 21%. Incomes from the Suez Canal and from petroleum contribute a further quarter, and agriculture represents only 2%.
The pie chart shows the amount of money Egypt earned from tourism between 1982 and 2003. in 1982, it only earned $0.3 billion, but this shot up over the next eleven years to $1.9 billion. it continued to rise until it reached a peak in 2000 of $4.3 billion, but then plunged suddenly, to a low of $1.8 billion in 2003, less than half the amount of the previous year.
In conclusion, although Egypt relied for a quarter of its income in 2002 on tourism, this amount varies sharply from year to year.
175 words